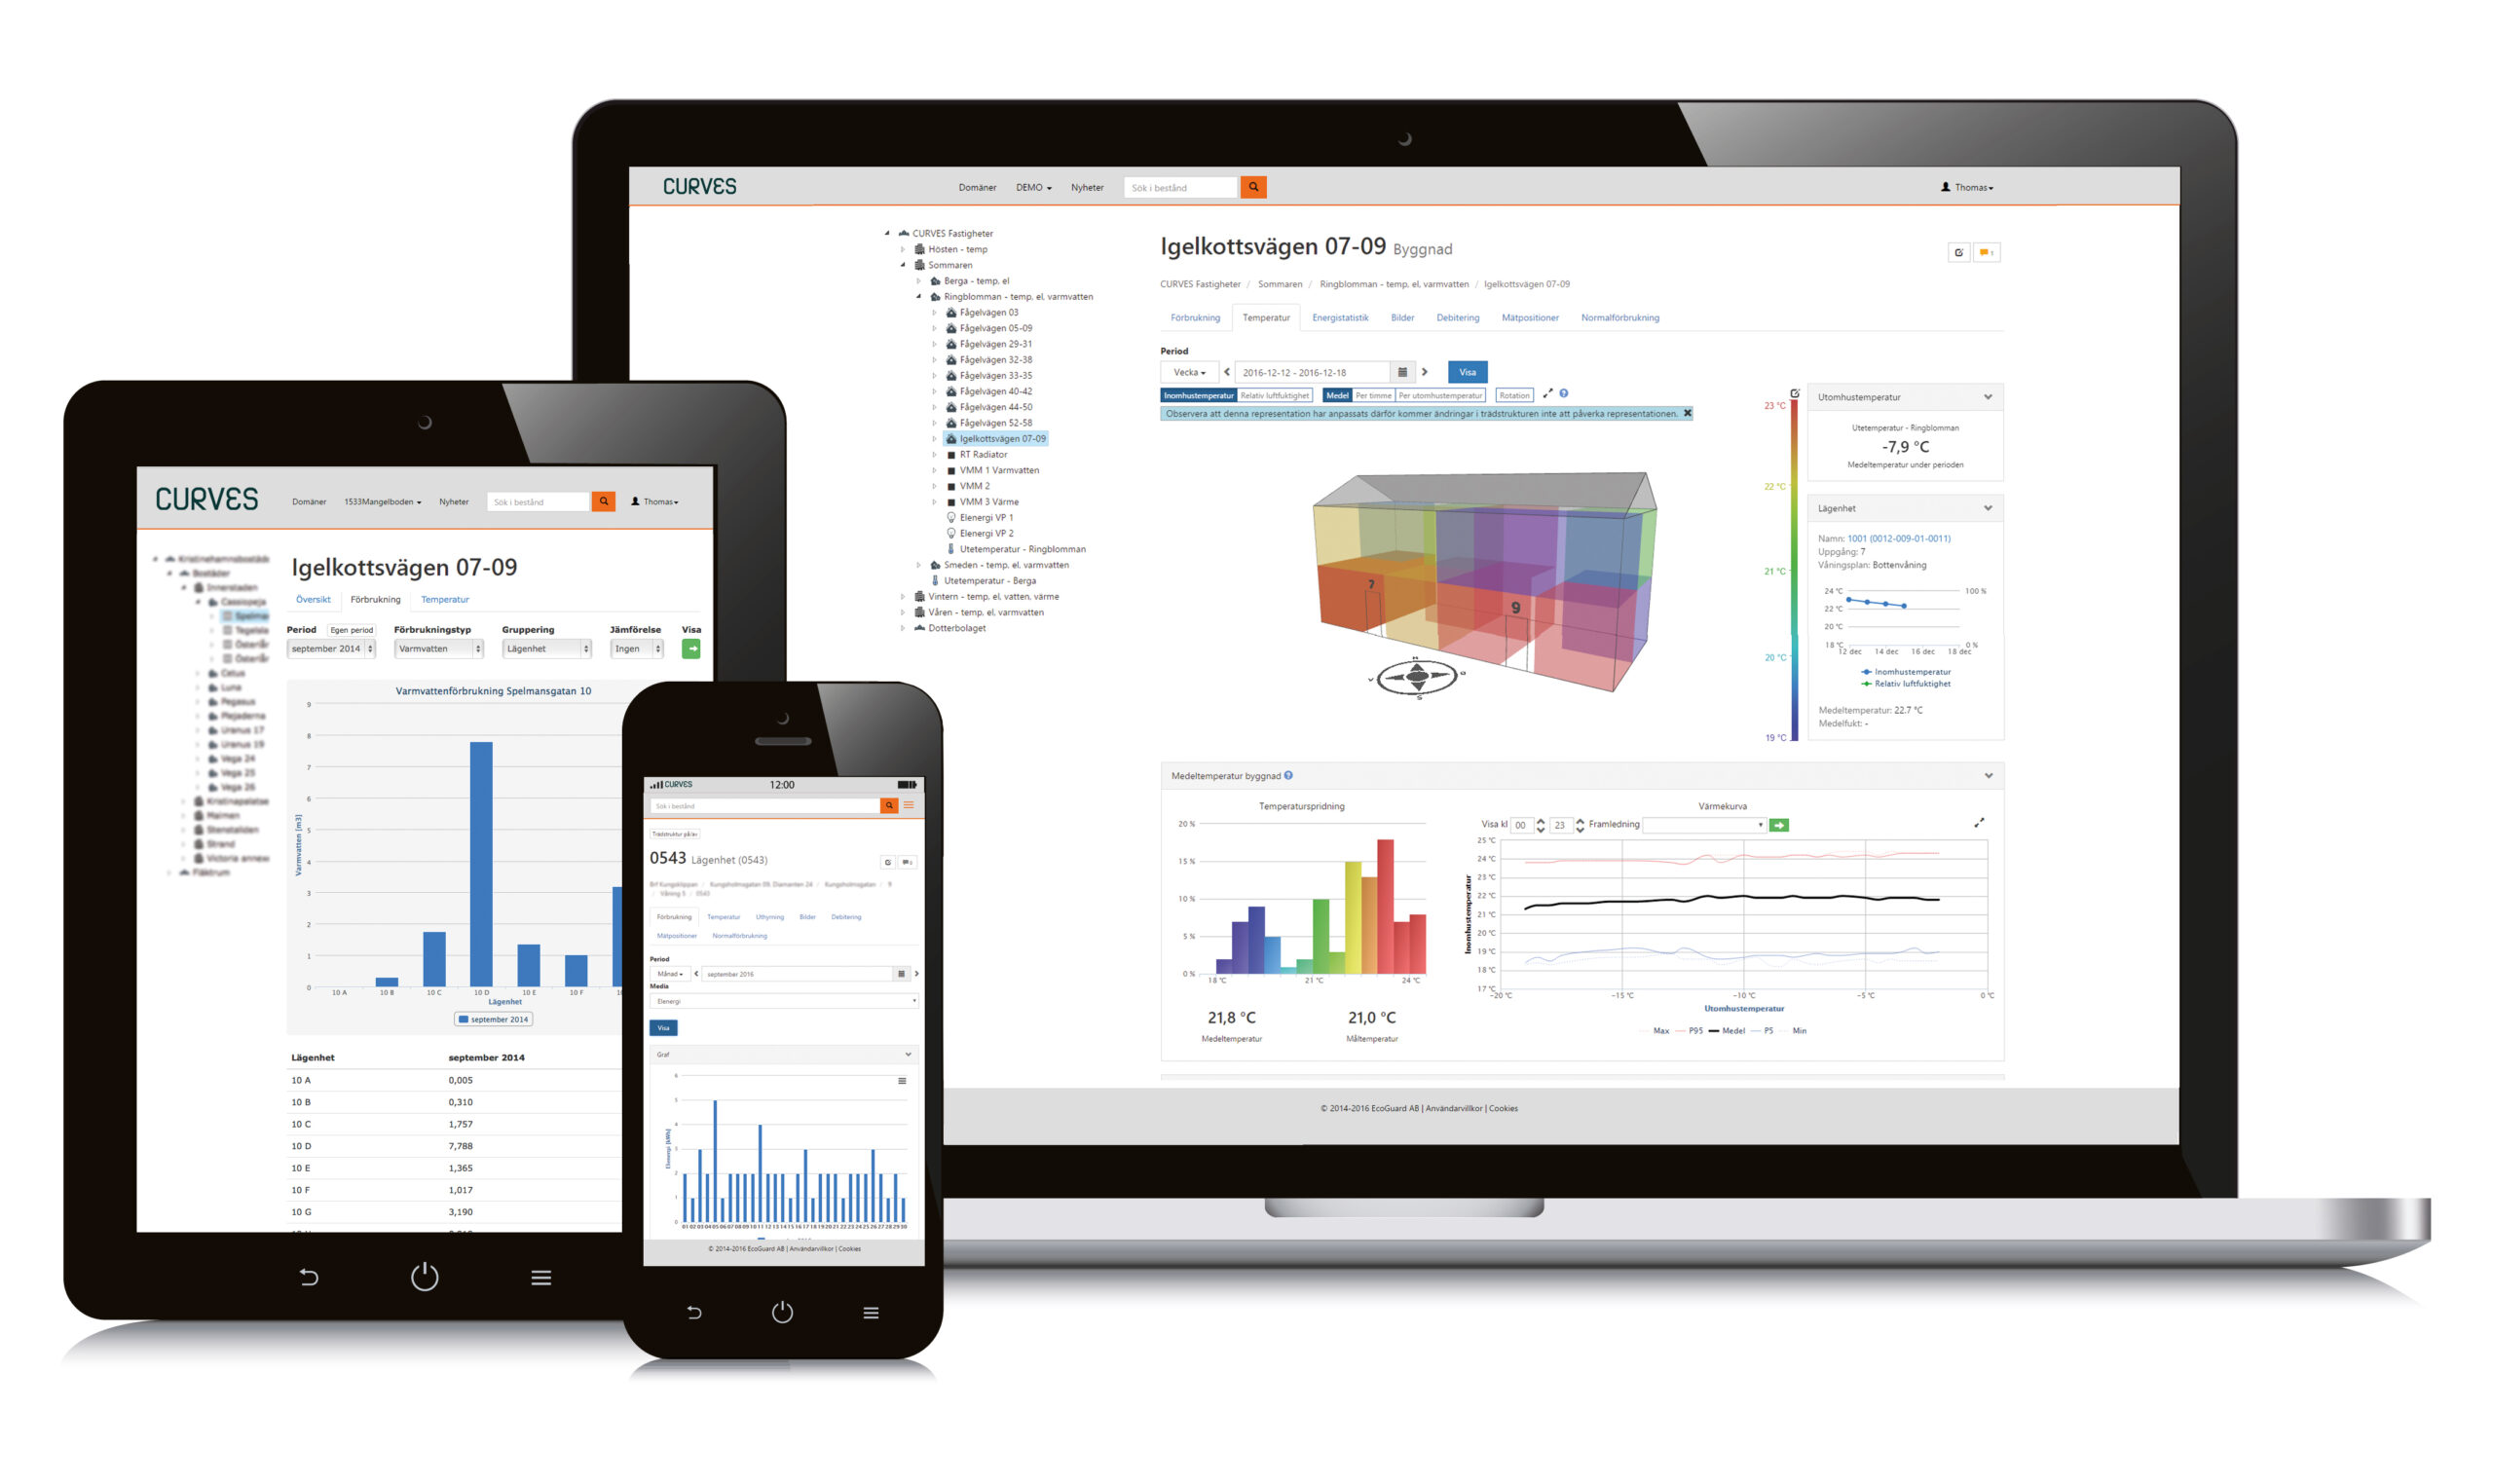
From 3D visualizations to resident portals, from energy reports to IMD – your journey toward smarter, more sustainable, and data-driven property management starts here.
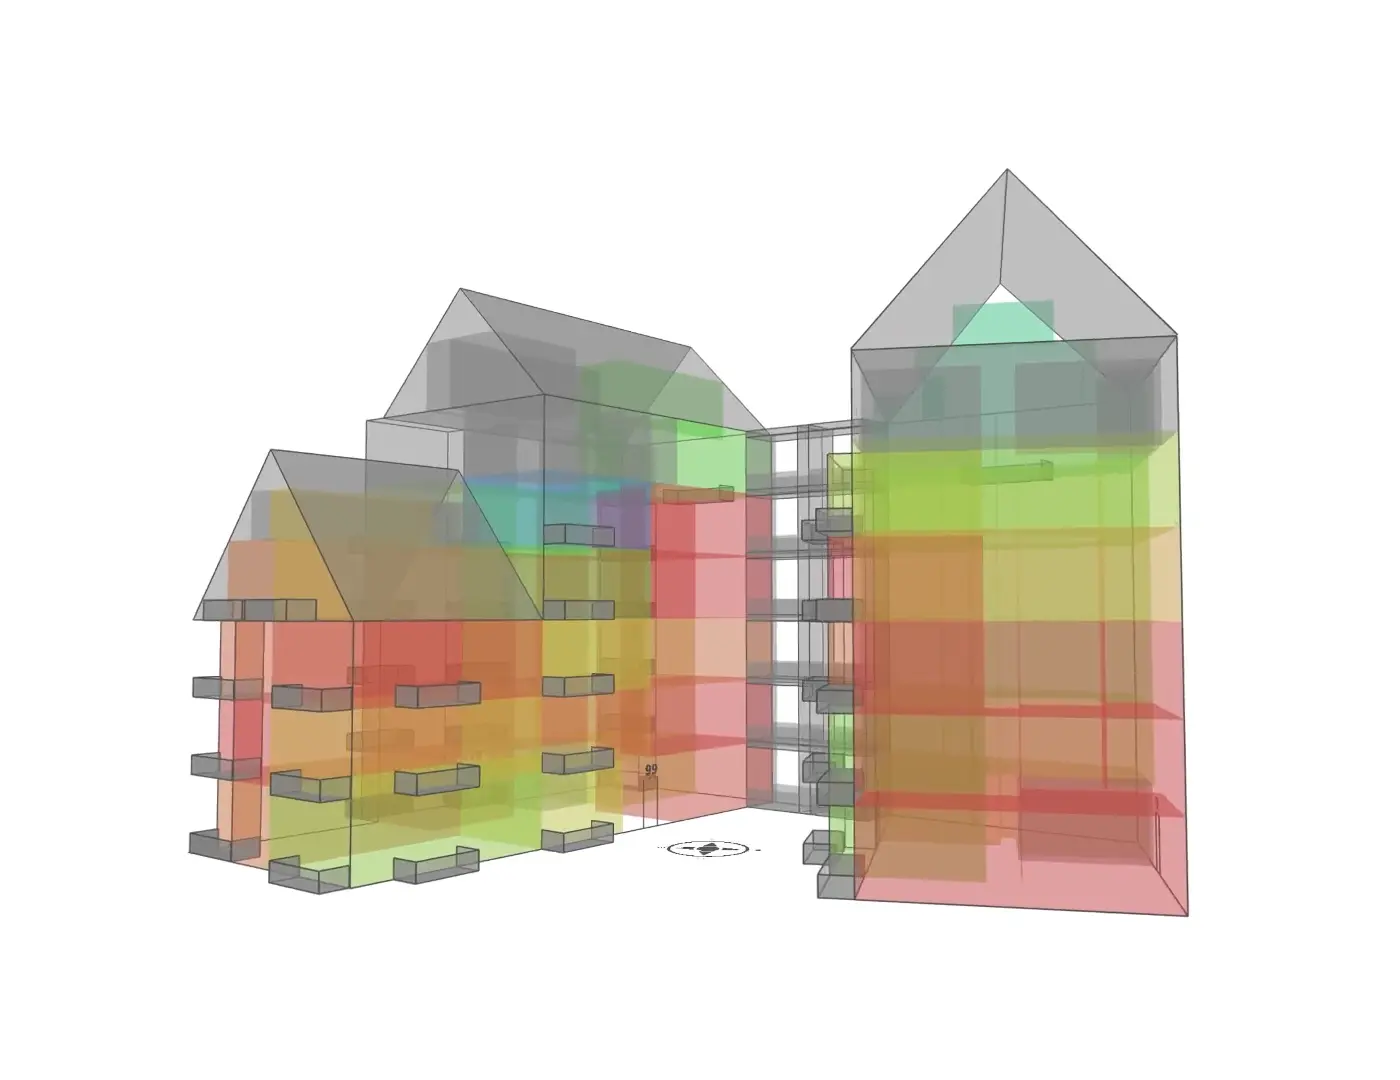
Quickly pinpointing the coldest and warmest apartments makes system balancing easier – creating the foundation for efficient heating optimization.
Curves combines sensor data with 3D visualization to give you a clear overview of temperature and humidity in every apartment – all within an interactive building model. It’s an easy way to detect issues early and take action before they become problems.
Curves clearly visualizes moisture levels in every apartment – helping you quickly detect deviations in ventilation or occupancy patterns before they cause problems.
From 3D visualizations to resident portals, from energy reports to IMD – your journey toward smarter, more sustainable, and data-driven property management starts here.
Quickly pinpointing the coldest and warmest apartments makes system balancing easier – creating the foundation for efficient heating optimization.
Curves combines sensor data with 3D visualization to give you a clear overview of temperature and humidity in every apartment – all within an interactive building model. It’s an easy way to detect issues early and take action before they become problems.
Curves clearly visualizes moisture levels in every apartment – helping you quickly detect deviations in ventilation or occupancy patterns before they cause problems.