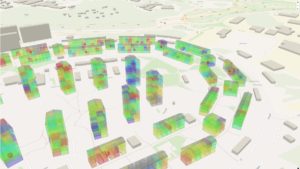
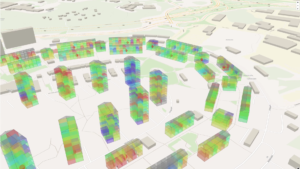
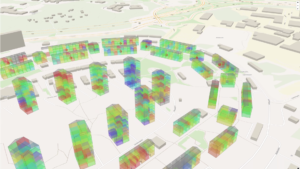
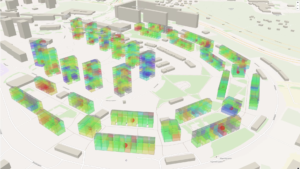
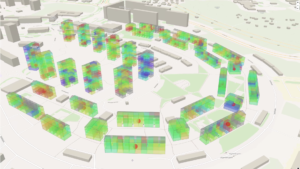
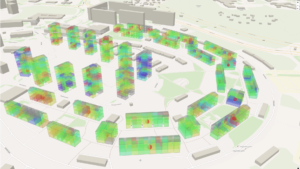
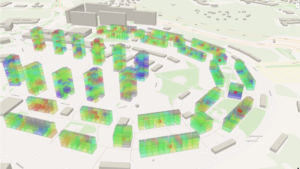
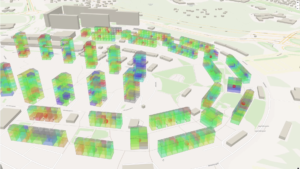
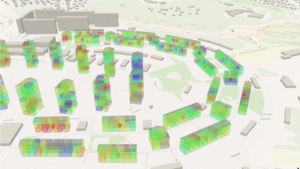
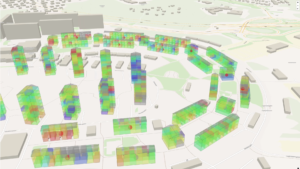
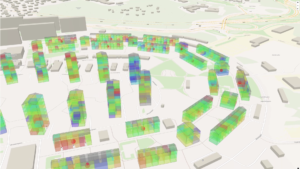
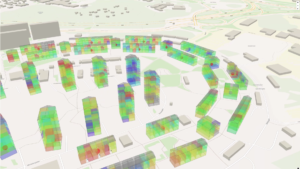
Visualization from Area Level to Individual Apartments
The markers represent the average temperature, while the dots represent the building’s temperature distribution.
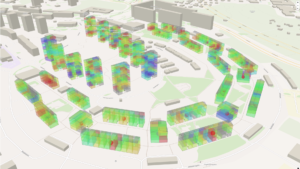
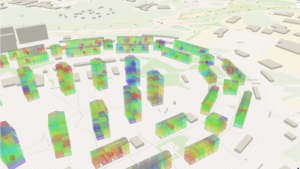
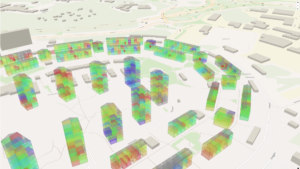
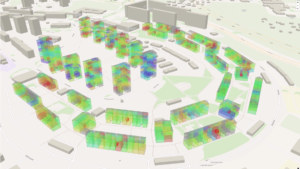
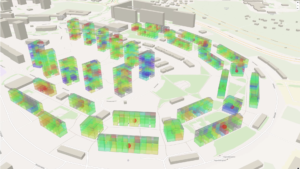
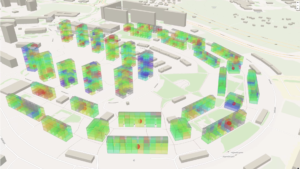
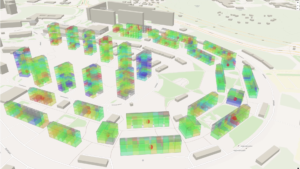
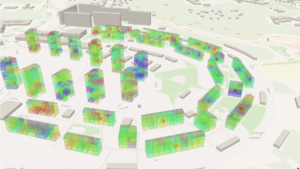
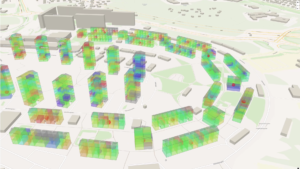
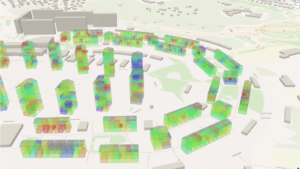
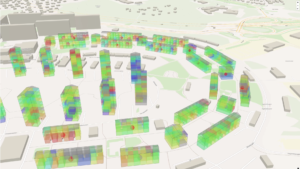
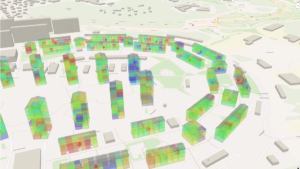
3D Houses on an Area Level
The markers transition into interactive 3D houses where the color indicates the building’s average temperature, while the dots visualize the building’s temperature distribution.
In Curves, multiple buildings can be placed within a shared 3D area using preloaded building models. The buildings are positioned easily with just a few clicks, quickly creating a clear digital overview of the entire area.
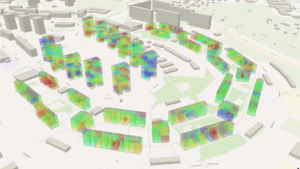
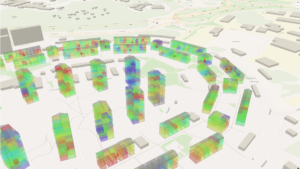
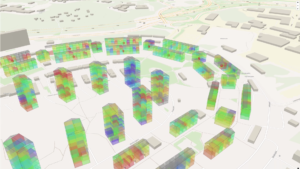
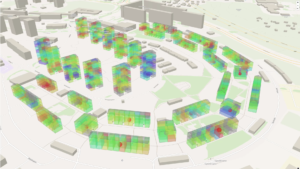
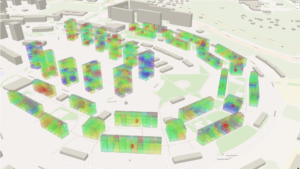
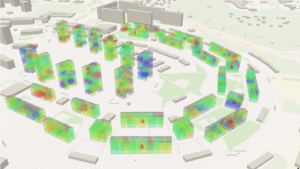
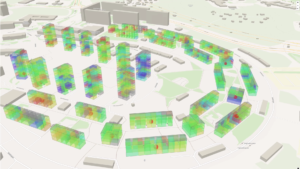
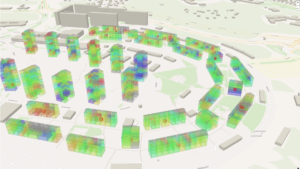
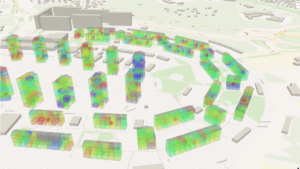
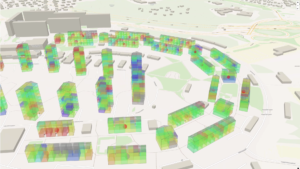
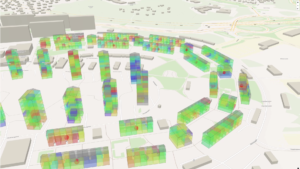
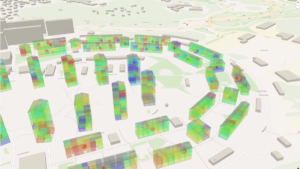
Zoom and Pan Freely
Easily zoom and pan to identify buildings with deviating conditions.
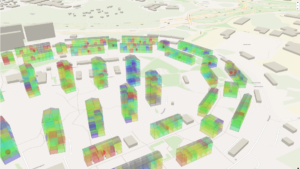
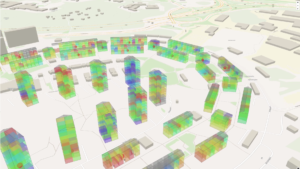
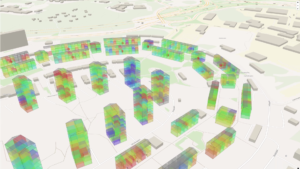
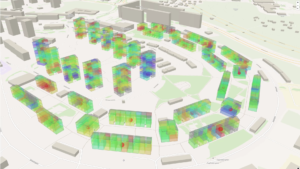
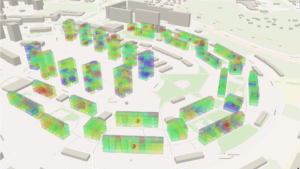
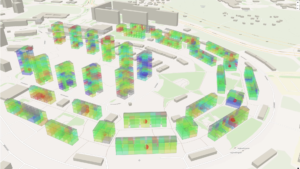
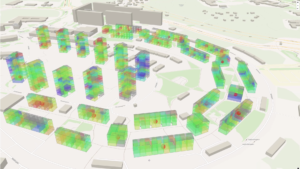
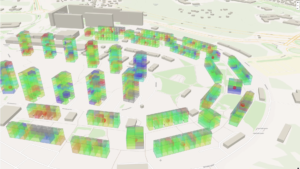
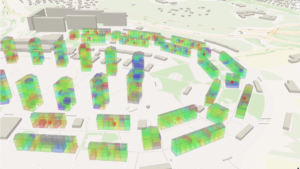
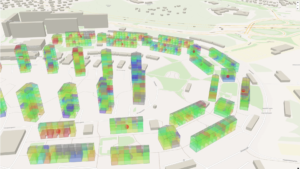
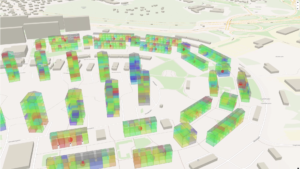
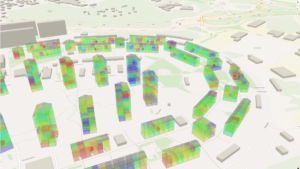
Visualize Multiple Indoor Climate Parameters
The 3D house can be used to visualize and analyze several types of measurement data:
- Temperature
- Relative Humidity
- Moisture Excess